- SS&C Blue Prism Community
- Get Help
- Product Forum
- RE: Memory leak?
- Subscribe to RSS Feed
- Mark Topic as New
- Mark Topic as Read
- Float this Topic for Current User
- Bookmark
- Subscribe
- Mute
- Printer Friendly Page
Memory leak?
- Mark as New
- Bookmark
- Subscribe
- Mute
- Subscribe to RSS Feed
- Permalink
- Email to a Friend
- Report Inappropriate Content
09-05-23 10:18 PM
Blue Prism memory leak?
BEFORE THE PROBLEM MANIFESTS
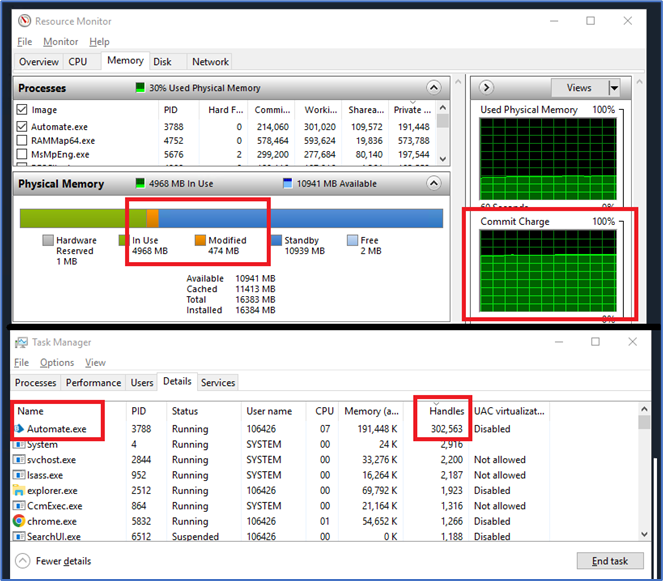
1. Some Blue Prism processes (called "problematic processes" here) cause the number of handles for Automate.exe process to grow without shrinking. The number goes up to around 300,000 before the problem starts.
a. This can be observed in Task Manager, on the "details" tab. On that tab, right-click one of the headers, choose "Select columns," and add the "Handles" column.
b. If a problematic process is stopped, the number of handles stays about the same level. It never shrinks back to a reasonable number.
2. While a problematic process is running, the modified memory can be seen growing and shrinking.
a. This can be observed in Resource Monitor, on the "memory" tab, in the "Phsyical Memory" section. Look for the orange bar while the process is running.
b. If the problematic process is stopped, the modified memory would either stay at the current rate or shrink back to a very low number within a few minutes.
3. While a problematic process is running, the commit charge goes up and up.
WHEN THE PROBLEM MANIFESTS
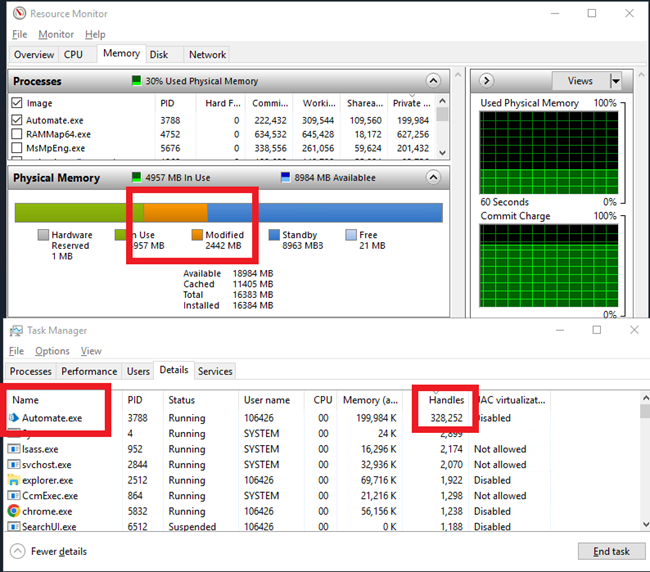
- When a problematic process is running and the number of handles goes above 300,000 or so, the problem begins.
2. Commit charge continues to climb.
3. Modified memory starts going up and never retreats. It eventually consumes all the memory, so that the "standby" and "free" memory are near zero and the resource machine becomes unusable.
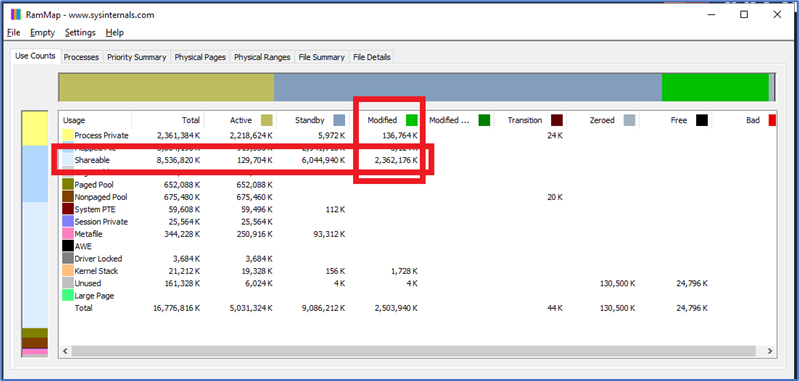
a. RamMap.exe (sysinternals tool) shows the following:
i. Use Counts tab: memory as usage "Shareable" with type "Modified".
ii. Processes tab: no apparent association with any process.
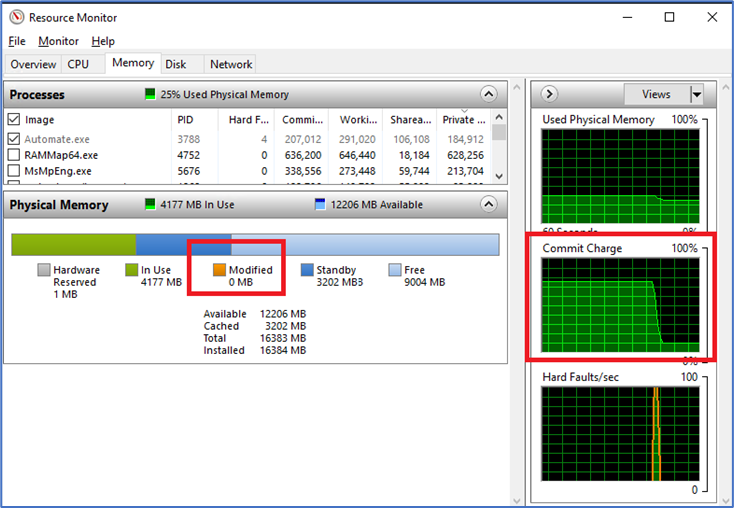
4. If the automate.exe process is stopped, the modified memory is reduced back to zero or near zero.
WHAT IS A PROBLEMATIC PROCESS?
1. The known problematic processes are those that: (a) interact with the Chrome or Edge browser (b) on Blue Prism 7.1.1, (c) have a web element in the tree, and (c) this element is used in a wait stage that checks for existence of the element many times.
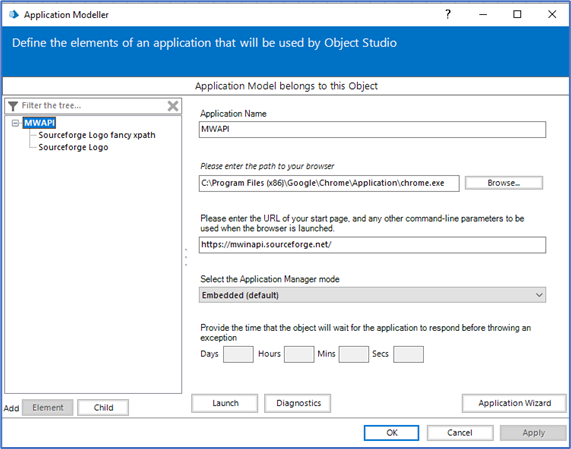
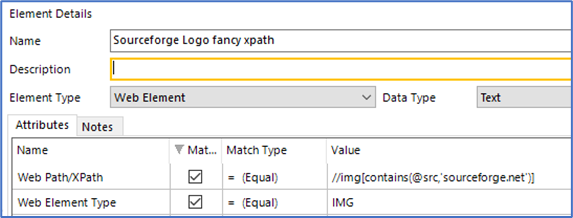
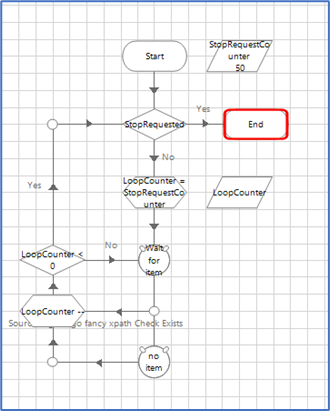
a. NOTE there may be other ways to cause the issue to manifest. This method is the first one we tried when attempting to duplicate the issue with as few steps as possible.
b. NOTE an identical process was created that did the exact same thing with notepad.exe instead of Chrome browser and the problem did not arise.
------------------------------
John Reynolds
------------------------------
- Mark as New
- Bookmark
- Subscribe
- Mute
- Subscribe to RSS Feed
- Permalink
- Email to a Friend
- Report Inappropriate Content
10-05-23 08:47 PM
Hi John,
Just as an initial suggestion, have you implemented the Process-design best-practices for preventing memory build-up outlined in this Knowledge Base article, "Are there any techniques for preventing memory issues when working with Blue Prism Enterprise Objects?"
If you're already performing regular detach actions, breaking Processes up into smaller sizes, and/or forcing garbage collection within the Process(es), are you still seeing this memory leak behavior?
------------------------------
Steve Boggs
Senior Product Support Engineer
Blue Prism
Austin, TX
------------------------------
- Mark as New
- Bookmark
- Subscribe
- Mute
- Subscribe to RSS Feed
- Permalink
- Email to a Friend
- Report Inappropriate Content
11-05-23 12:11 PM
This is a great level of detail, John, and looks like something my team should be reviewing as a product bug. Could you raise this as a ticket with the Support team so we can track this for you? Some additional logs etc from you may be useful as part of that investigation.
Also definitely recommend following Steve's advice to see if the issue can be resolved at process design level too.
Thanks!
------------------------------
Liam Riley
------------------------------
- Mark as New
- Bookmark
- Subscribe
- Mute
- Subscribe to RSS Feed
- Permalink
- Email to a Friend
- Report Inappropriate Content
11-05-23 05:24 PM
Thanks, Liam and Steve for your attention.
We have opened a support ticket and are currently working with one of your Co-Workers (Ashley M)
The sample process we use to reproduce the issue is quite small.
Detaching/reattaching did not affect the handle count.
Calling GC.Collect() did not affect the handle count.
We created an identical process/object with Edge.exe instead of Chrome.exe, it also leaked.
We created an identical process/object with NOTEPAD.exe instead of Chrome.exe, it did NOT leak.
Closing down the automation does not resolve the issue.
Only shutting down automate.exe clears things up.
Thanks again, and by the way so far Ashley M has been very helpful and responsive. Great to see such attentive folks. I hope we can get to the errant line of code and make things better for everyone soon!
------------------------------
John Reynolds
------------------------------
- Mark as New
- Bookmark
- Subscribe
- Mute
- Subscribe to RSS Feed
- Permalink
- Email to a Friend
- Report Inappropriate Content
12-05-23 09:46 AM
Hi John,
Thanks for this very useful post, we have been experiencing a similar bug in the last few days, so would really appreciate it if you could post whatever fix you find in this thread. 🙂
------------------------------
Harriet Gray
------------------------------
- Mark as New
- Bookmark
- Subscribe
- Mute
- Subscribe to RSS Feed
- Permalink
- Email to a Friend
- Report Inappropriate Content
15-05-23 08:45 PM
Harriet,
I created a support ticket and the Blue Prism developers have successfully reproduced the issue on their side. They are working on a fix. In the meantime, as a workaround, we are stopping and starting automate.exe on our runtime resources before the number of handles gets above 300,000.
------------------------------
John Reynolds
------------------------------
- Mark as New
- Bookmark
- Subscribe
- Mute
- Subscribe to RSS Feed
- Permalink
- Email to a Friend
- Report Inappropriate Content
19-06-23 09:54 AM
Hi @bp_wes
Thank you so much for raising this issue both here and on the support team - I can confirm that we're publishing a known issue against Blue Prism 7.1 and 7.2 to make users aware of this issue.
Can I ask, in order to 300k handles, were you running browser automation processes for a protracted period without restarting resources or was this something you saw over a short period of time?
Regards,
Rob
------------------------------
Robert Nicklin
Product Manager
Blue Prism
Warrington, England
------------------------------
Associate Director of Product
Blue Prism
Warrington, England
- NOTICE: Breaking Change to "Email - POP3/SMTP/IMAP" VBO. in Digital Exchange
- System.OutOfMemoryException: Blue Prism is getting Hanged. in Product Forum
- Memory Management in Long-Running Blue Prism Processes in Product Forum
- MS Excel VBO in Digital Exchange
- Email - POP3/SMTP/IMAP - Send Message error in Code in Digital Exchange
