- Subscribe to RSS Feed
- Mark as New
- Mark as Read
- Bookmark
- Subscribe
- Email to a Friend
- Printer Friendly Page
- Report Inappropriate Content
Blue Prism is a highly flexible and extensible platform for Intelligent Automation. Many use cases can be addressed through the use of pre-built connectors, available on the Blue Prism Digital Exchange, or through the creation of UI models created in Application Modeler. In some cases, you may have to leverage Code stages for maximum flexibility or to integrate with custom or homegrown APIs/SDKs. In situations like this, it’s important to understand the various options for debugging your Code stages if you encounter issues with your custom code during testing.
While Code stages are extremely flexible, they don’t provide the same level of debug capability that a full-blown Integrated Development Environment (aka IDE) like Visual Studio or VS Code do. However, there are options that can improve your debugging of Code stages. Those options include .NET’s System.Windows.Forms.MessageBox class, the open source NLog logging framework, and Visual Studio. In this post, we’re going to discuss the use of the MessageBox class from the System.Windows.Forms namespace.
System.Windows.Forms.MessageBox Class
Anyone who has written UI code for .NET is likely familiar with the System.Windows.Forms namespace and especially with the MessageBox class contained within that namespace. The MessageBox class provides a quick-and-easy solution for displaying a simple, graphical message box to the user. The developer can configure the display of the pop-up using various input parameters as well as passing in the contents of the specific message that should be displayed. This includes being able to pass in variables and have their value displayed to the user. This provides a quick and simple way to collect debugging information about your Code stages.
To use the System.Windows.Forms.MessageBox class:
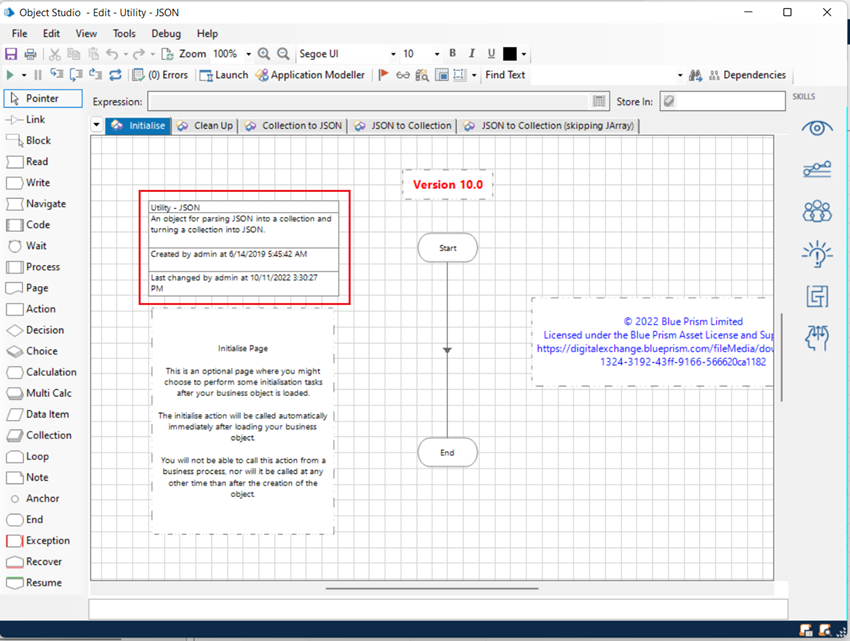
1. Open the Visual Business Object (aka VBO) that contains the Code stage(s) you intend to debug. In this example, I’ll be using the standard Utility – JSON VBO. On the Initialise tab, double click on the Information block.
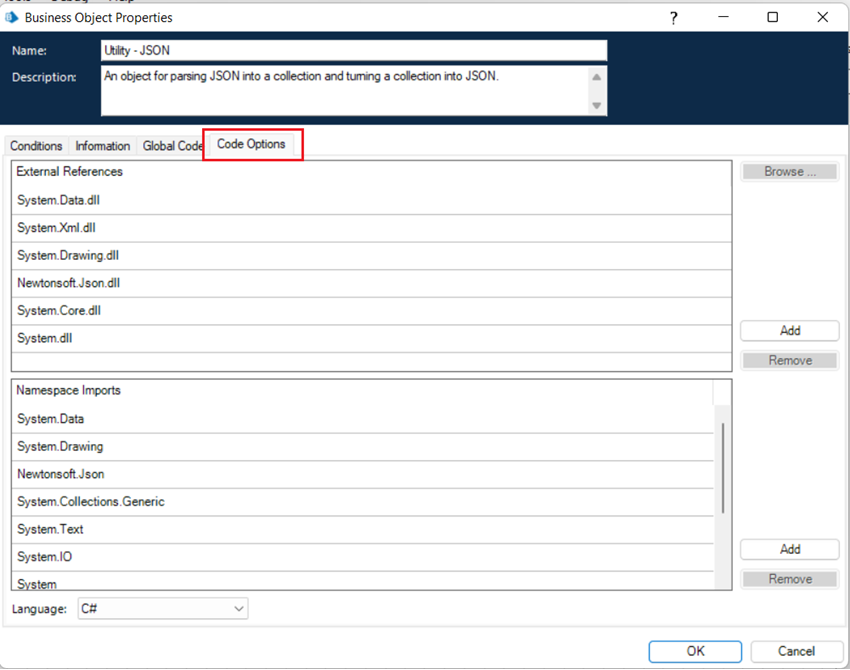
2. In the Business Object Properties dialog, click the Code Options tab.
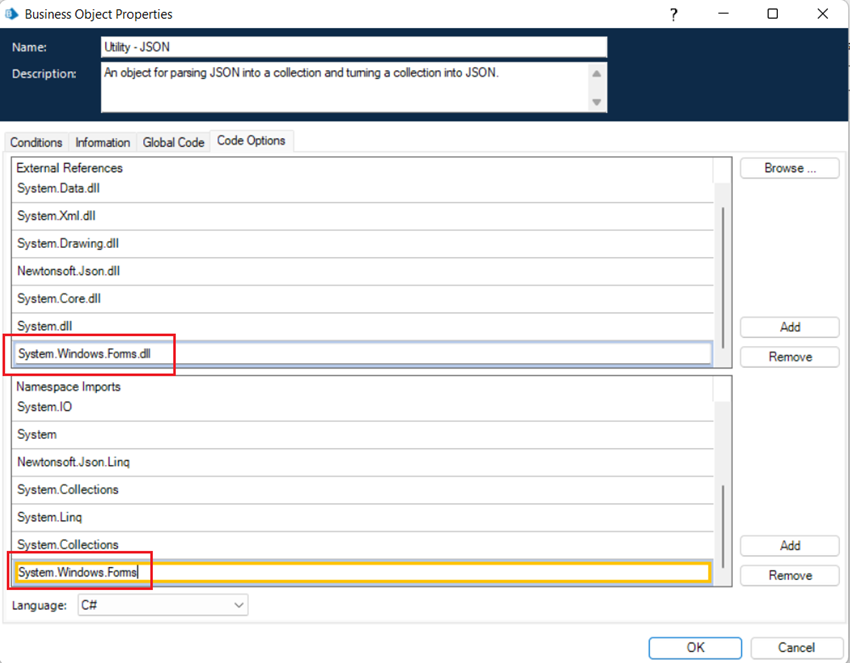
3. On the Code Options tab, we need to add an entry to the External References for the System.Windows.Forms.dll assembly and an entry to the Namespace Imports for the System.Windows.Forms namespace.
4. Once you’ve added those, click OK to accept the changes. You’re now ready to make use of the MessageBox class in your Code stages.
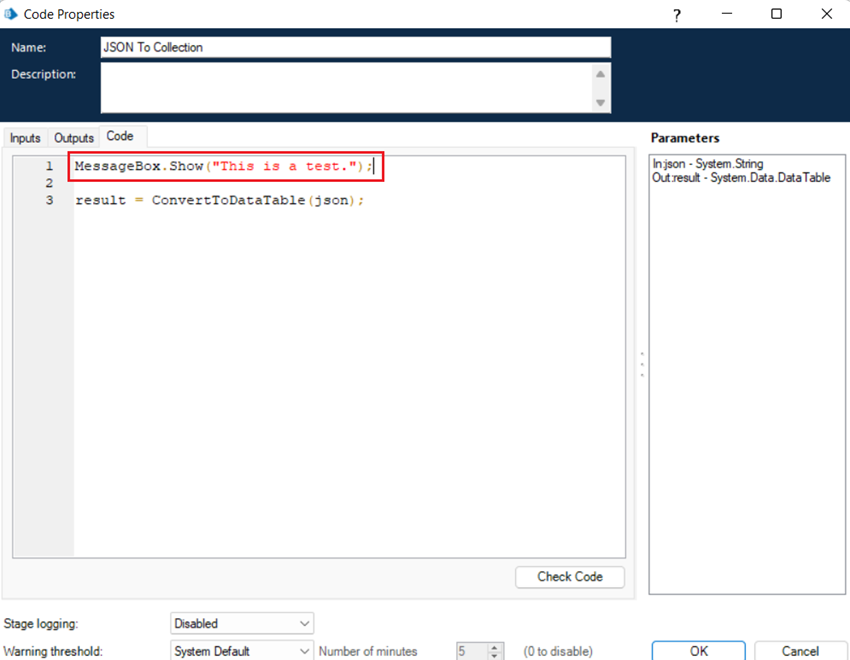
Here’s an example of calling the static Show() method of the MessageBox class. This is the Code stage within the JSON to Collection action of the Utility – JSON VBO.
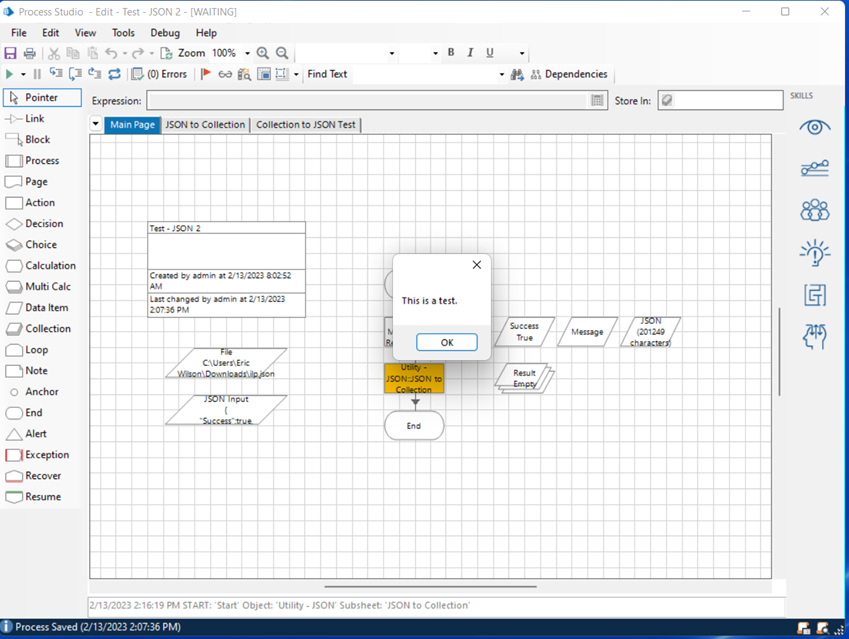
Now, when you run or step through your process from the Interactive Client, you’ll see pop-ups like this:
It’s as simple as that!
If you want to include any of your variable values, simply append them to the content of the Show() method using standard C#/VB language features.
C# Example:
MessageBox.Show(“This is the value: “ + MyVariableName);
NOTE: Before moving a VBO from your test environment to production, make sure to remove any calls to MessageBox.Show(). Otherwise, your process will block each time that method is called.
In future blog posts, we’ll discuss the use of the open source NLog logging framework and how to leverage Visual Studio or VS Code to make your testing and debugging life easier.
